

100,000 installations in analytics!
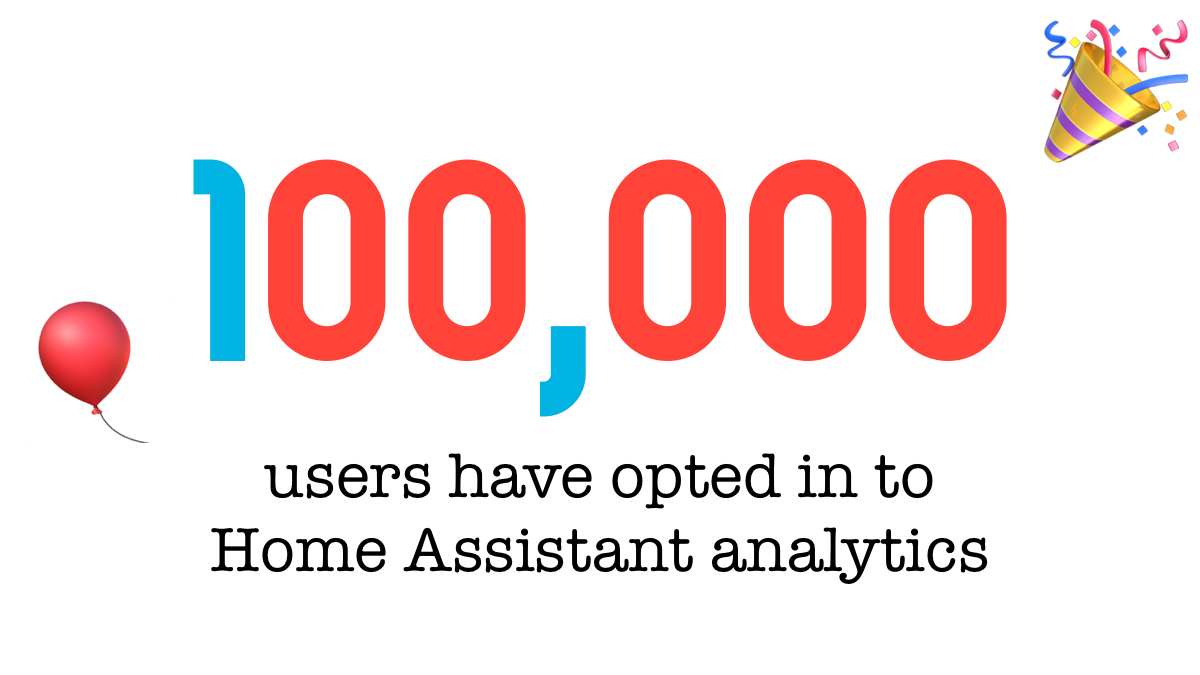
Today we have reached a major milestone for Home Assistant Analytics: 100,000 users have opted in to be included!
This is a big deal because it's not enabled by default, users have to opt-in, and we only launched Home Assistant Analytics last April. We promoted it in the 发布 博客 post and during live streams, but have never nagged existing users in the interface. New users did get asked to opt-in as part of onboarding.
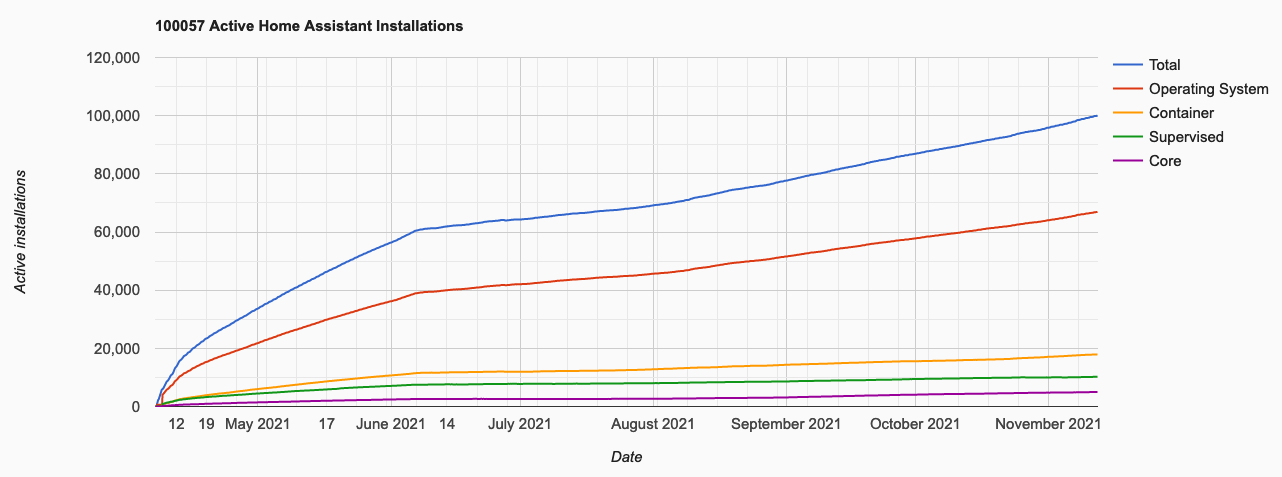
The 100,000 installations are not the total number of Home Assistant users. The truth here is that we don't know the total number of installations because Home Assistant is private by design. Our estimate is that there are 4-5x more installations than people that opt-in to analytics.
For the latest 版本 of the graphs in this post, visit Home Assistant Analytics
Why we collect data
It's good to start off with why we allow users to opt-in to share some data with us.
Manufacturers of IoT products live in their own world in which we have little presence. We don't have stands at CES or other trade shows. Instead, manufacturers see we're 开源 and assume it's a small user base. They assume the ability to integrate with Home Assistant and other platforms is not profitable enough to allocate resources to add the necessary APIs to integrate.
With the data collected by Home Assistant Analytics, we can show that providing an API can expand their market around the globe.
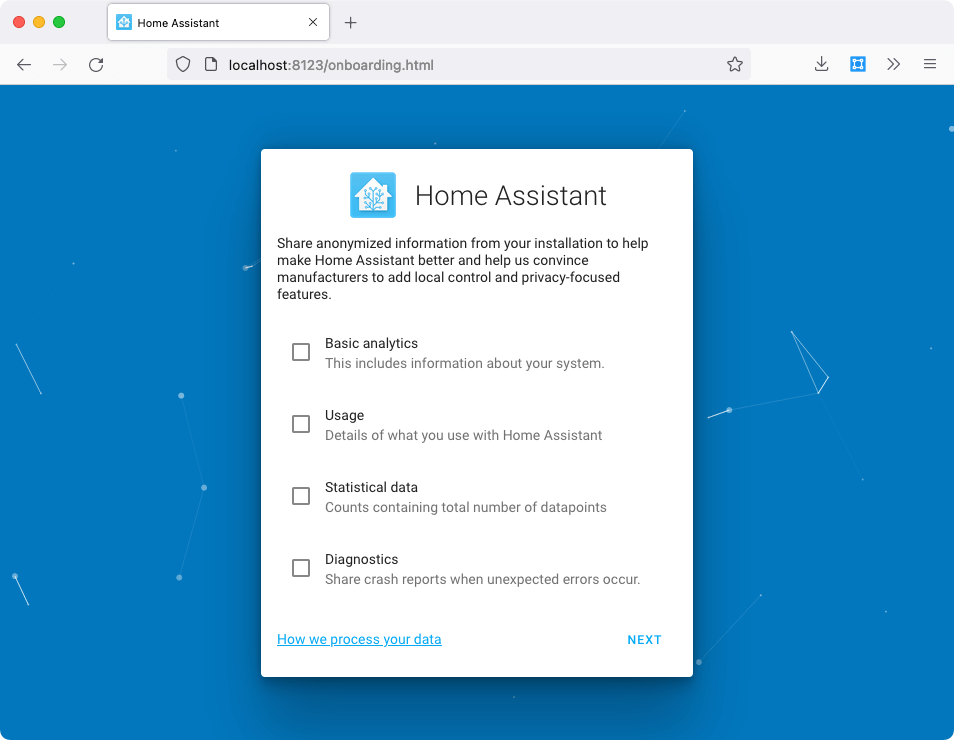 Screenshot of analytics during Home Assistant onboarding
How people run Home Assistant
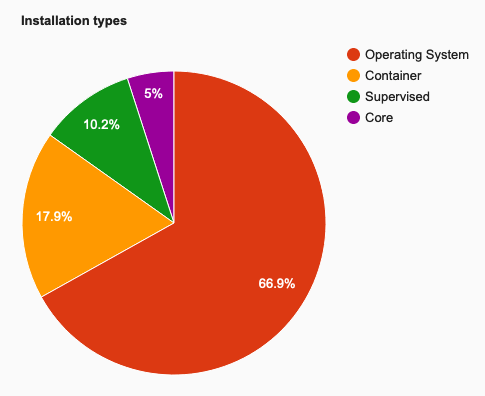
The collected data is also used to give us, the Home Assistant 开发者, insight into how Home Assistant is 已安装 and what we should improve. As you can see in our 安装 breakdown, the operating system 安装 type is by far the most popular. This makes sense because it is our recommended 安装 type and the easiest to use. It gives the full Home Assistant experience and can be fully managed via the user interface. No text editors, Linux experience, or computer science degree necessary.
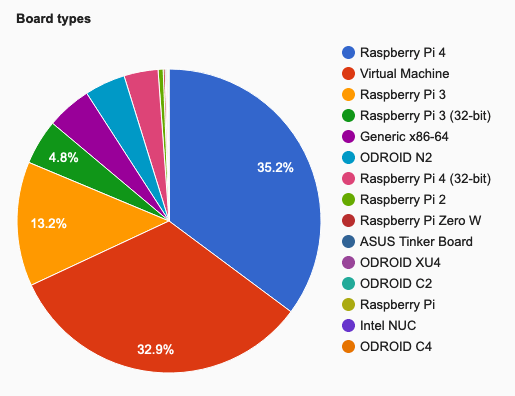
The board breakdown below only applies to the operating system 安装 type. The 树莓派 family of 设备 is by far the most popular way of running Home Assistant, followed by running it in a virtual machine. Running Home Assistant in a virtual machine is popular because it is our recommended approach for people that already have a server at home.
Tracking updates
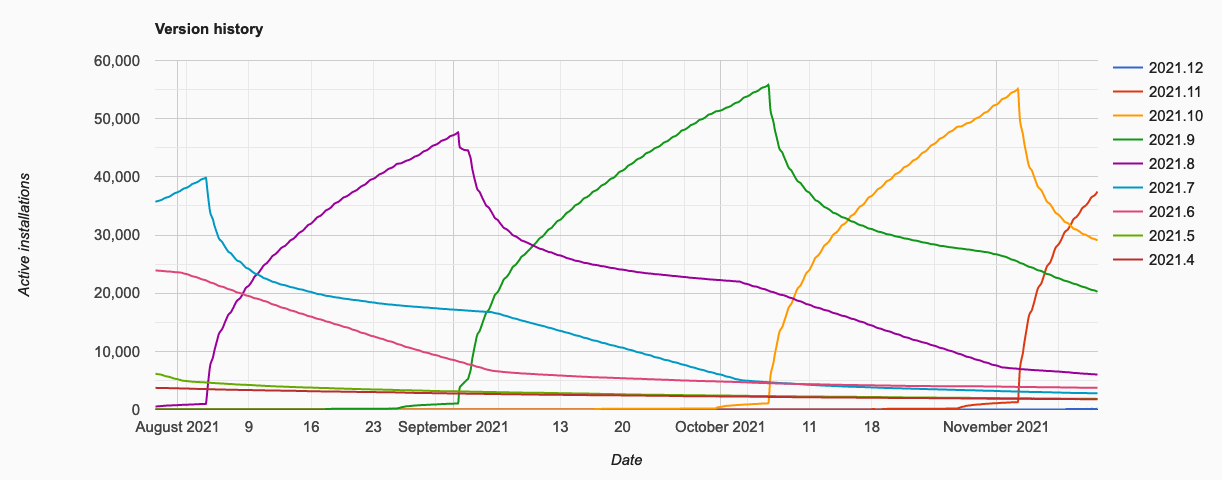
We have spent a lot of time making sure that it is easy to 更新 both Home Assistant 核心 and Home Assistant Operating System. Ease of updates is important because when critical bugs or security issues arise, users should feel confident to hit the 更新 button.
Home Assistant can be updated using a single click in the interface and will automatically roll back if the 更新 fails or the system fails to come online afterward. This gives our users the confidence to 更新 and we see this reflected in the speed at which our users 更新 when a new monthly 发布 drops:
Home Assistant around the world
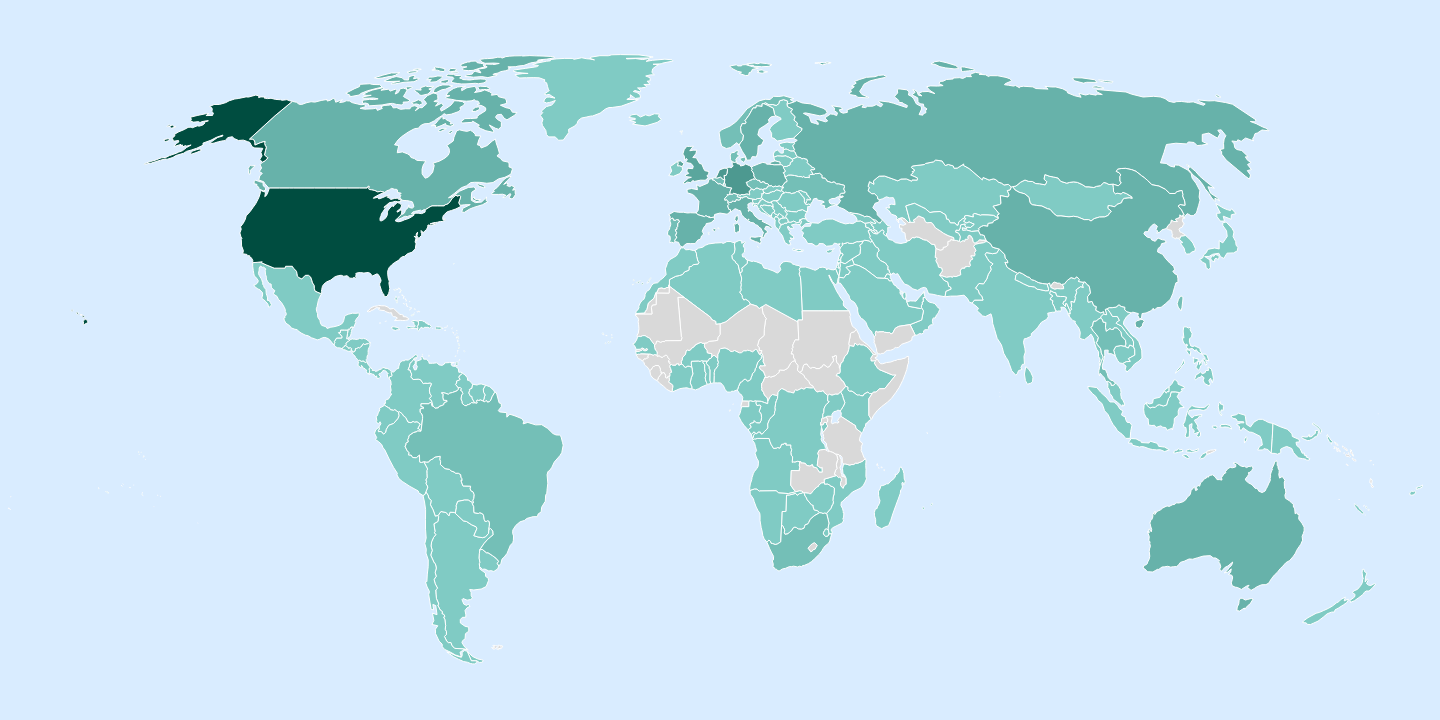
It's our goal to make the privacy focused smart home a viable option for everyone, everywhere. That's why Home Assistant is free and 开源, translated into 60 different languages and why we integrate with products from around the world, not just the ones that are big enough to come to America or Europe.
As you can see on our map we have a global reach. Some countries only see a few users, like the country of Nepal having 13 installations. However, with 开源 all we need is 1 contributor to help translate our user interface into their native language and make it more accessible for speakers of that language. To learn more about helping translating Home Assistant, check the 文档.
集成
There are multiple levels of analytics that users can opt-in to. The basic level is how you run Home Assistant but you can also share what 集成 you use.
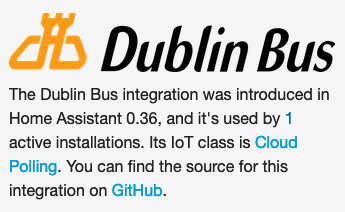
This data is integrated into the Home Assistant website when users navigate the various 集成. It sometimes highlights certain 集成 that serve their purpose but don't have a big audience, like the integrations for the Dublin bus schedule:
However, more interesting is of course the most popular 集成. I'm always surprised how high MQTT is on this list and very happy to see ESPHome doing so well.
| Rank | 集成 | Installations |
|---|---|---|
| 1 | 35151 (43.5 %) | |
| 2 | 33252 (41.2 %) | |
| 3 | 30338 (37.5 %) | |
| 4 | 22771 (28.2 %) | |
| 5 | 16422 (20.3 %) | |
| 6 | 14315 (17.7 %) | |
| 7 | 13705 (17.0 %) | |
| 8 | 12592 (15.6 %) | |
| 9 | 12110 (15.0 %) | |
| 10 | 11533 (14.3 %) |
For the full list, see Home Assistant Analytics.
We see that 集成 that offer automated discovery do very well. This makes sense because once discovered we'll prompt the user to set them up:
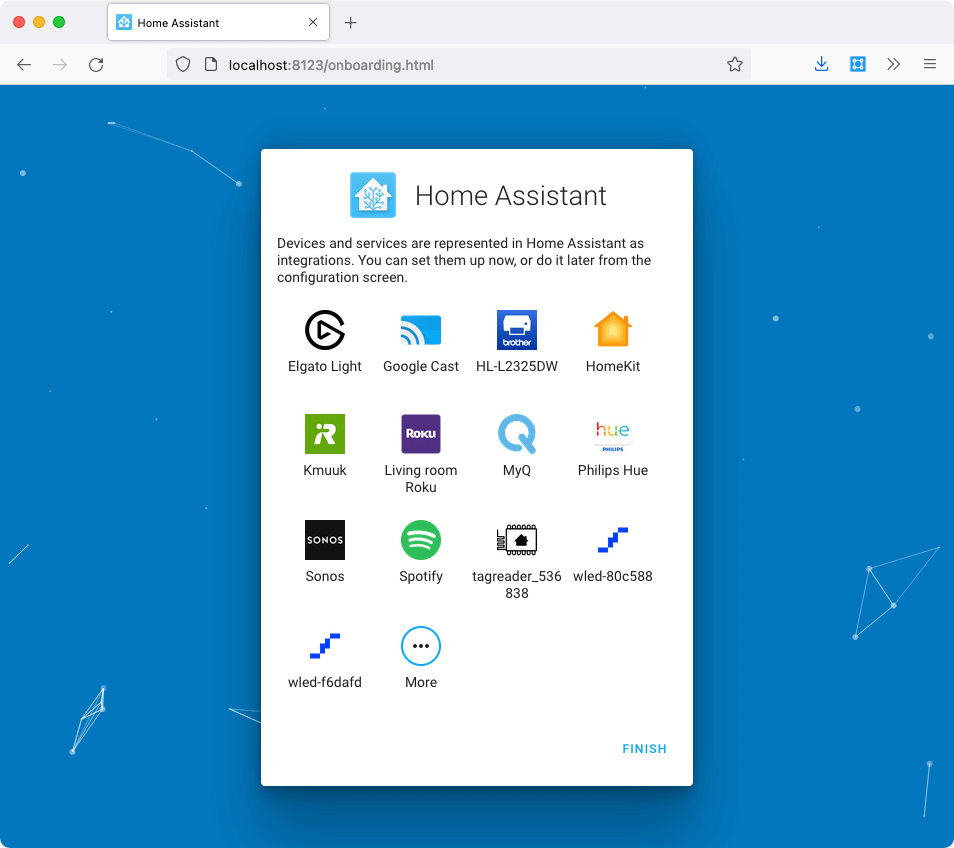 Screenshot of setting up 集成 during Home Assistant onboarding
Statistics
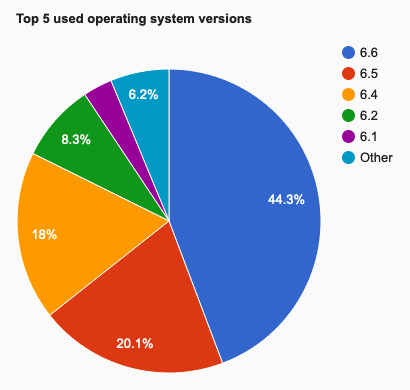
It is also possible to share some basic statistics about your 安装 like how many 状态 and users you have.
- Average number of 自动化: 24
- Average number of 集成: 74
- Average number of 已安装 add-ons: 7.01
- Average number of 实体: 204
- Average number of users: 1.87
It's impressive to see the high number of 集成 and 实体 that are being used in Home Assistant. Our users sure love automating their homes!
Opt-in to analytics!
If you haven't yet, please opt-in to Home Assistant Analytics by clicking the button below to help us and manufacturers better understand our impact.