Netdata

The Netdata integration allows you to display information collected by Netdata.

Prerequisites

正在运行的 Netdata 实例,可从 Home Assistant 实例访问。有关设置 Netdata 的更多信息,请查看他们的文档

Setup

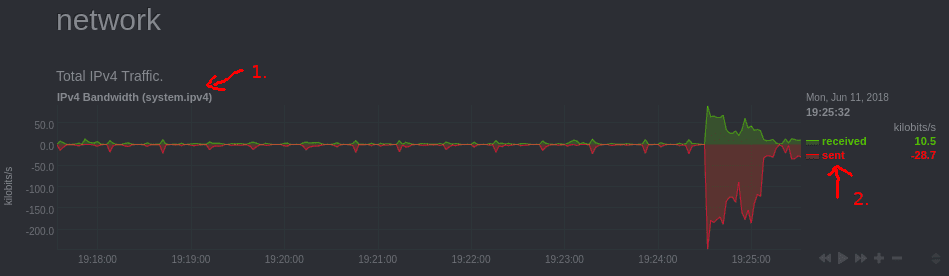
获取配置传感器的详细信息有点棘手,因为 Netdata 对所需的“element:”值使用不同的名称。要获取“data_group:”的值,请使用 Netdata 的 Web 界面。 “1.”标记“data_group:”的名称。 “2.”是在 Home Assistant 中显示的元素的名称。显示的名称可能与可用指标的名称不同。

要检查“element:”名称是否与 Netdata 前端中的名称匹配,请将“curl”与 Netdata 实例的 IP 地址、其端口和“data_group”一起使用:

$ curl -X GET "http://[Netdata_Instance]:19999/api/v1/data?chart=[data_group]&points=2&options=jsonwrap"
{
   "api": 1,
   "id": "system.ipv4",
   "name": "system.ipv4",
[...]
   "dimension_names": ["received", "sent"],
   "dimension_ids": ["InOctets", "OutOctets"],
[...]
  • dimension_names:前端显示的名称。
  • dimension_ids:用于element的名称。

或者,您可以在浏览器中浏览到内置的 Netdata API“http://[Netdata_Instance]:19999/api/v1/allmetrics?format=json”,然后搜索 Netdata 前端中标识的“data_group”。在下面的示例 JSON 中,数据组是“system.load”。

	"system.load": {
		"name":"system.load",
		"context":"system.load",
		"units":"load",
		"last_updated": 1558446920,
		"dimensions": {
			"load1": {
				"name": "load1",
				"value": 0.1250000
			},
			"load5": {
				"name": "load5",
				"value": 0.1290000
			},
			"load15": {
				"name": "load15",
				"value": 0.1430000
			}
		}
	},

Once the data_group "system.load" and the element "load15" have been identified from the JSON it can be configured in your configuration.yaml file. After changing the configuration.yaml file, restart Home Assistant to apply the changes. The integration is shown on the integrations page under Settings > Devices & services. Its entities are listed on the integration card itself and on the Entities tab.

Configuration

Add the following to your configuration.yaml.

# Example configuration.yaml entry
sensor:
  - platform: netdata
    resources:    
      load:
        data_group: system.load
        element: load15
host:
  description: The IP address or hostname of your Netdata instance.
  required: false
  type: string
  default: localhost
port:
  description: The port that the Netdata instance is running on.
  required: false
  type: integer
  default: 19999
name:
  description: Name of the monitored Netdata instance.
  required: false
  type: string
  default: Netdata
resources:
  description: List of details to monitor.
  required: true
  type: map
  keys:
    name:
      description: Name to use for the sensor in the frontend.
      required: true
      type: string
      keys:
        data_group:
          description: "Name of the data group to monitor, e.g., `system.cpu`."
          required: true
          type: string
        element:
          description: The element of the group to monitor.
          required: true
          type: string
        icon:
          description: Icon to use for the sensor.
          required: false
          type: icon
          default: "mdi:desktop-classic"
        invert:
          description: Invert the sensor values.
          required: false
          type: boolean
          default: false

Full example

# Example configuration.yaml entry
sensor:
  - platform: netdata
    host: "192.168.1.2"
    port: "19999"
    name: SomeHostName
    resources: 
      system_load:
        data_group: system.load 
        element: load15
      core0_freq:
        data_group: "cpu.cpufreq"
        element: "cpu0"
        icon: mdi:chip