

能源卡片
以下列出了能源仪表盘中使用的所有卡片和徽章。您也可以将它们放置在仪表盘中的任意位置。
您可以在能源配置页面中配置它们。
能源日期选择器
 能源日期选择卡片截图。
此卡片可让您选择要显示的数据。在此卡片中更改设置会影响所有其他卡片中的数据。 打开日期范围选择器后,您可以选择具体日期和时间范围。您还可以在菜单中使用比较数据选项,将当前时间段与上一个时间段进行比较。
Example
能源使用图表
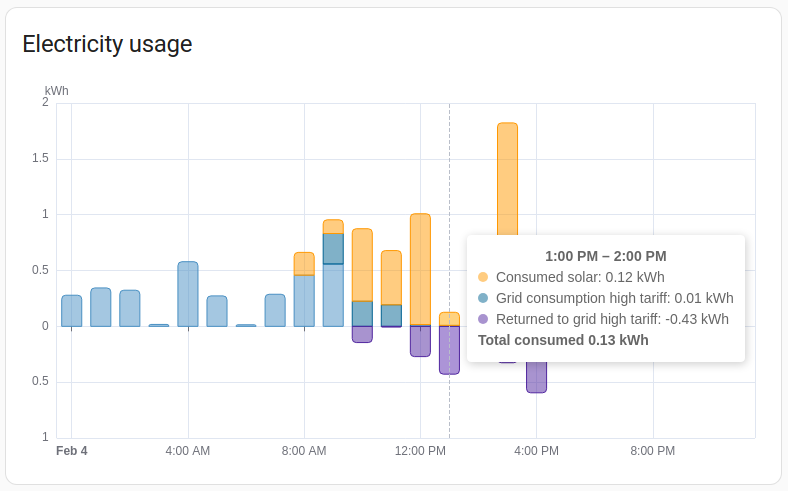 能源使用图表卡片截图。
能源使用图表卡片显示您家中消耗了多少能源,以及这些能源来自哪些来源。 它还会显示您回馈到电网的能源数量。
YAML 配置
可以使用以下 YAML 选项。
type:
required: true
description: "energy-usage-graph"
type: string
collection_key:
required: false
description: "卡片使用的集合键。它会将卡片关联到特定的能源仪表盘集合。默认为 energy_dashboard。"
type: string
default: energy_仪表盘
title:
required: false
description: 定义后,会显示带有标题文字和总能耗标签的卡片页眉。
type: string
Example
太阳能发电图表
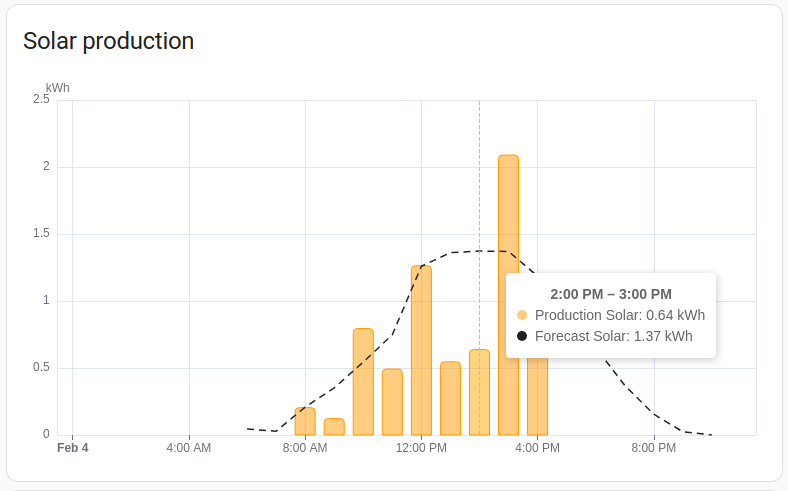 太阳能发电图表卡片截图。
太阳能发电图表卡片显示您的太阳能板按来源产生的能源量;如果已设置且支持,还会显示太阳能发电预测。
YAML 配置
可以使用以下 YAML 选项。
type:
required: true
description: "energy-solar-graph"
type: string
collection_key:
required: false
description: "卡片使用的集合键。它会将卡片关联到特定的能源仪表盘集合。默认为 energy_dashboard。"
type: string
default: energy_仪表盘
title:
required: false
description: 定义后,会显示带有标题文字和太阳能总发电量标签的卡片页眉。
type: string
Example
燃气消耗图表
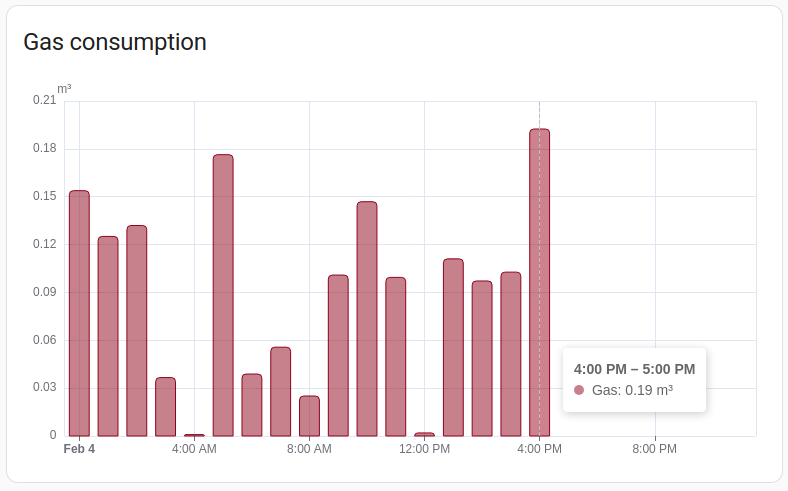 燃气消耗图表卡片截图。
燃气消耗图表卡片显示每个来源的燃气消耗量。
type:
required: true
description: "energy-gas-graph"
type: string
collection_key:
required: false
description: "卡片使用的集合键。它会将卡片关联到特定的能源仪表盘集合。默认为 energy_dashboard。"
type: string
default: energy_仪表盘
title:
required: false
description: 定义后,会显示带有标题文字和总燃气消耗标签的卡片页眉。
type: string
Example
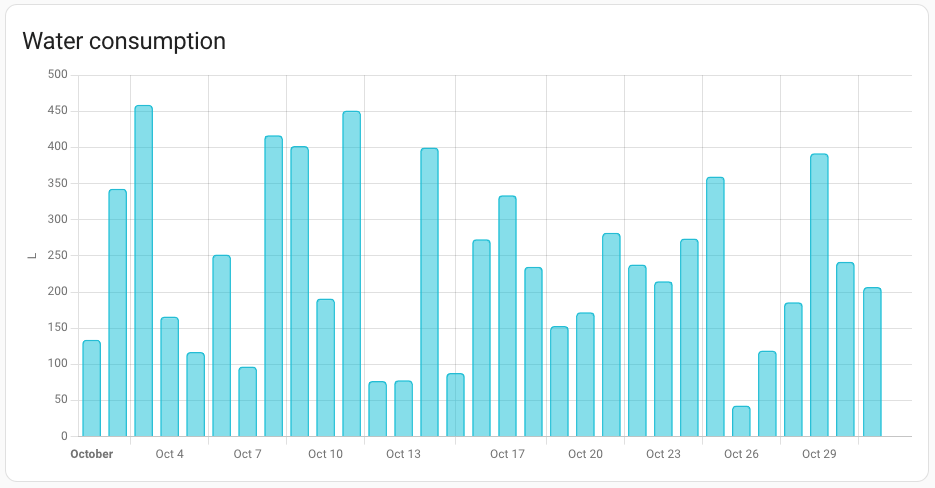
用水消耗图表
 用水消耗图表卡片截图。
用水消耗图表卡片显示每个来源的用水量。
YAML 配置
可以使用以下 YAML 选项。
type:
required: true
description: "energy-water-graph"
type: string
collection_key:
required: false
description: "卡片使用的集合键。它会将卡片关联到特定的能源仪表盘集合。默认为 energy_dashboard。"
type: string
default: energy_仪表盘
title:
required: false
description: 定义后,会显示带有标题文字和总用水量标签的卡片页眉。
type: string
Example
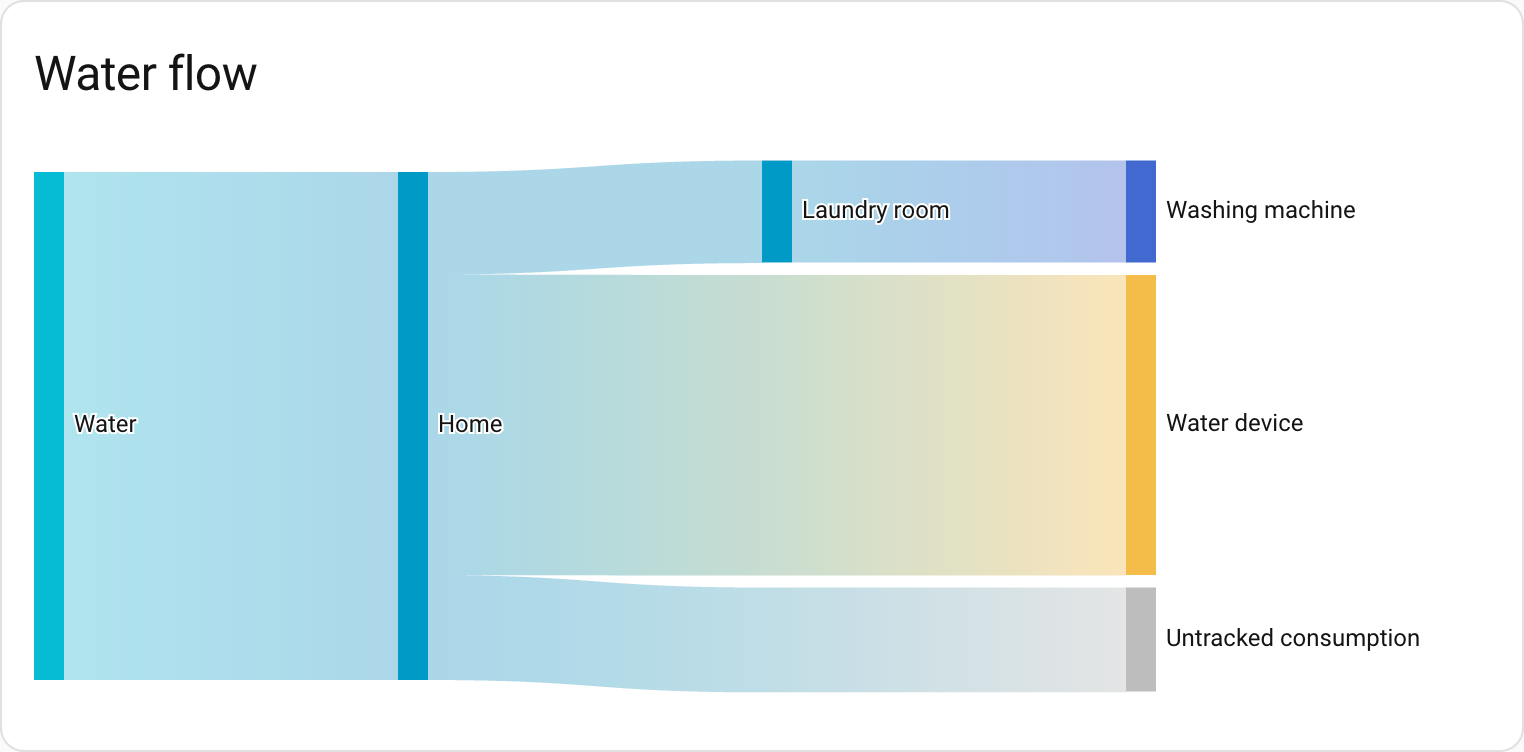
用水桑基图
 用水桑基图卡片截图。
用水桑基图显示家中用水的流向。它会可视化水从来源流向各个用水方的过程。如果已配置,设备会按楼层和区域分组。
此卡片会根据能源日期选择器中选定的日期范围显示历史用水数据。
YAML 配置
可以使用以下 YAML 选项:
type:
required: true
description: "water-sankey"
type: string
collection_key:
required: false
description: "卡片使用的集合键。它会将卡片关联到特定的能源仪表盘集合。"
type: string
title:
required: false
description: 卡片标题。
type: string
layout:
required: false
description: "vertical、horizontal 或 auto。决定卡片的方向(流向)。auto 会根据屏幕尺寸自动调整。"
type: string
default: auto
group_by_area:
required: false
description: 是否按区域对设备进行分组。
type: boolean
default: true
group_by_floor:
required: false
description: 是否按楼层对设备进行分组。
type: boolean
default: true
Examples
以下示例将流向设置为从左到右:
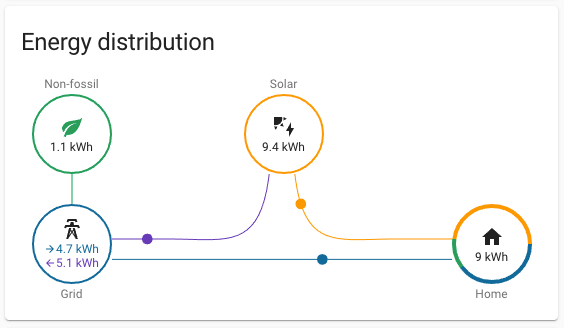
能源分布
 能源分布卡片截图。
能源分布卡片显示能源如何流动,例如从电网流向您的家、从太阳能板流向您的家,以及或回馈到电网。
如果已设置,它还会显示您从电网获得的能源中,有多少千瓦时是在不使用化石燃料的情况下生产的。
如果将 link_dashboard 设置为 true,卡片将包含一个指向能源仪表盘的链接。
Example
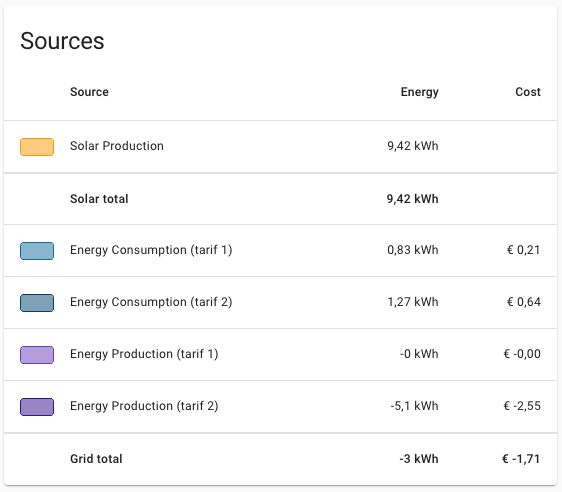
能源来源表
 能源来源表卡片截图。
能源来源表卡片显示您的所有能源来源以及对应的能源数量。 如果已设置,它还会显示每个来源的成本、补偿以及总计。
YAML 配置
可以使用以下 YAML 选项。
type:
required: true
description: "energy-sources-table"
type: string
types:
required: false
description: "定义后,表格只显示列出的消耗类型。有效值为:grid、solar、battery、gas 和 water。"
type: list
Example
电网中和度仪表
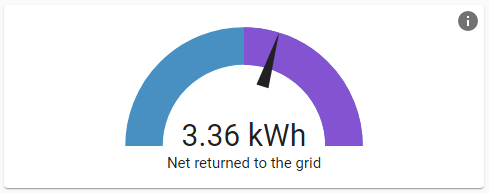 电网中和度仪表卡片截图。
电网中和度仪表卡片表示您对电网的能源依赖程度。如果指针位于紫色区域,表示您回馈给电网的能源多于从电网获取的能源。如果位于蓝色区域,表示您从电网获取的能源多于回馈的能源。
Example
太阳能自用率仪表
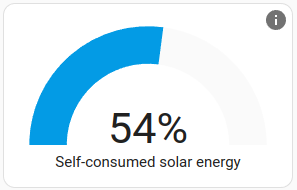 太阳能自用率仪表卡片截图。
太阳能自用率仪表表示您的家中使用了多少太阳能,而这些太阳能没有回馈到电网。如果您经常回馈大量电力,可以考虑安装电池,或购买电动车来消纳这些能源。
Example
低碳能源占比仪表
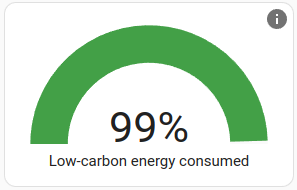 低碳能源占比仪表卡片截图。
低碳能源占比仪表卡片表示您家中消耗的能源中,有多少是通过太阳能、风能和核能等非化石燃料产生的。其中也包括您自己发电的太阳能。
Example
自给率仪表
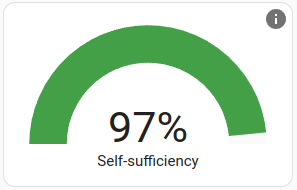 自给率仪表卡片截图。
自给率仪表表示您的家在能源方面有多大程度实现自给。如果您依赖电网输入,这个数值就会降低。您可以通过增加太阳能发电能力或电池储能来提高该值。
Example
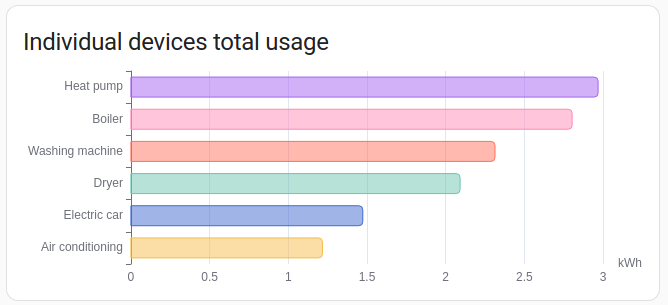
设备能耗图表
 设备能耗图表卡片截图。
设备能耗图表按设备显示能耗,并按使用量排序。
YAML 配置
可以使用以下 YAML 选项。
type:
required: true
description: "energy-devices-graph"
type: string
title:
required: false
description: 卡片标题。
type: string
max_设备:
required: false
description: 默认情况下,此卡片会显示您的所有设备。您也可以通过添加 max_devices 选项来限制显示的设备数量。如果可用设备多于显示数量,则会显示能耗最高的设备。
type: integer
hide_compound_stats:
required: false
description: 隐藏诸如断路器之类的上层设备。这些设备被设置为其他设备的 included_in_stat。
type: boolean
default: false
Examples
以下示例将显示的设备数量限制为 5 个:
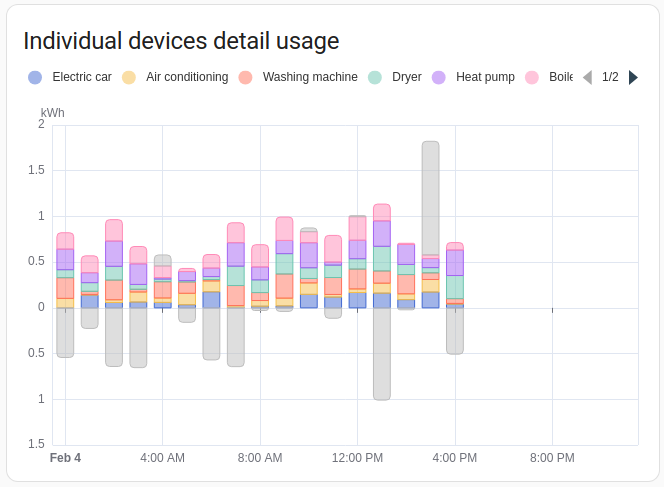
设备能耗详情图表
 设备能耗详情图表卡片截图。
设备能耗详情图表卡片与设备能耗图表卡片类似,但会按时间轴显示各设备的使用情况。
默认情况下,此卡片会显示您的所有设备。您也可以通过添加 max_devices 选项来限制显示的设备数量。如果可用设备多于显示数量,则会显示能耗最高的设备。
Examples
以下示例将显示的设备数量限制为 5 个:
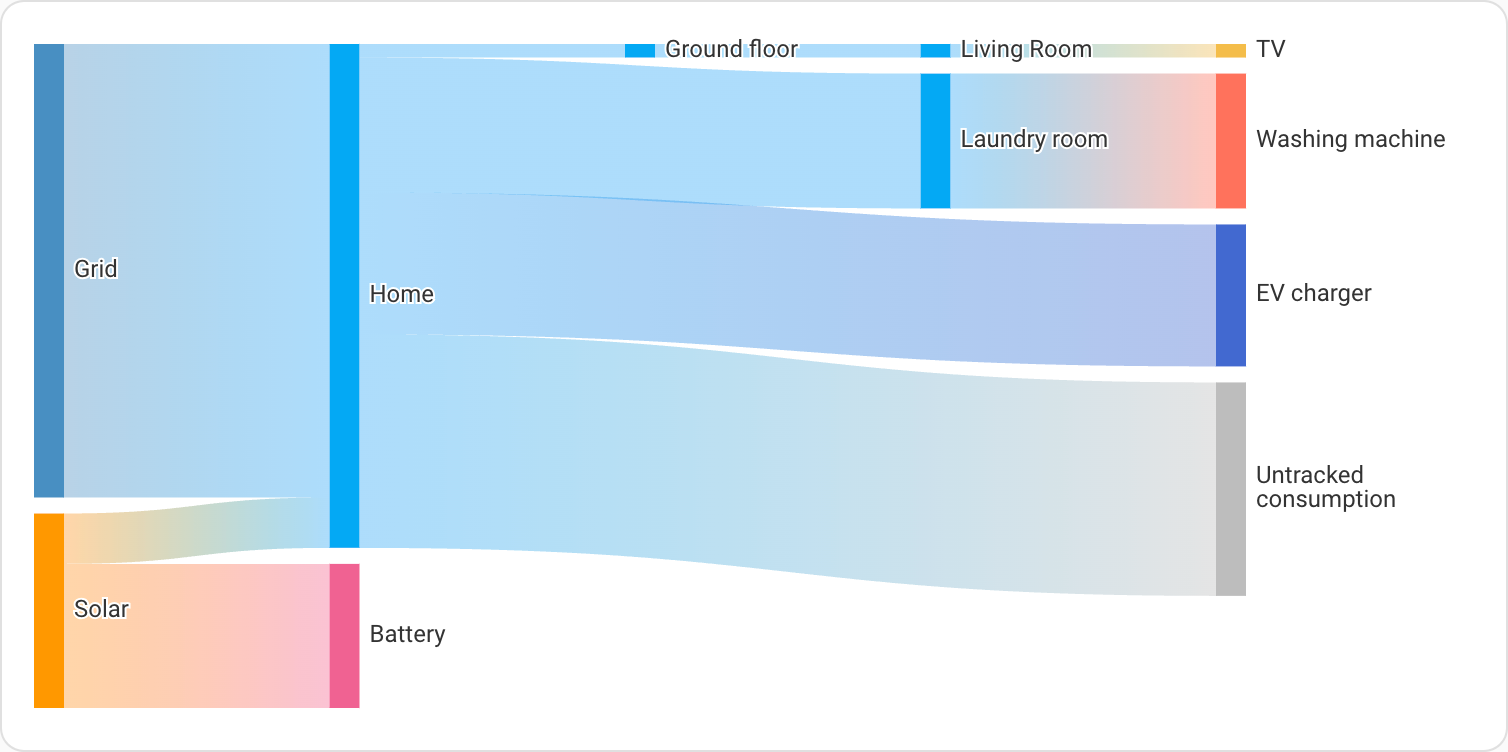
能源桑基图
 能源桑基图卡片截图。
能源桑基图显示家中能源的流动情况。它从能源来源开始,流向各个消耗端。如果已配置,设备会按楼层和区域分组。
YAML 配置
可以使用以下 YAML 选项。
type:
required: true
description: "energy-sankey"
type: string
title:
required: false
description: 卡片标题。
type: string
layout:
required: false
description: "vertical、horizontal 或 auto。决定卡片的方向(流向)。auto 会根据屏幕尺寸自动调整。"
type: string
default: auto
group_by_area:
required: false
description: 是否按区域对设备进行分组。
type: boolean
default: true
group_by_floor:
required: false
description: 是否按楼层对设备进行分组。
type: boolean
default: true
Examples
以下示例将流向设置为从上到下:
用于可视化功率流的功率桑基图
功率桑基图卡片截图。
功率桑基图显示家中功率的实时流向。不同于根据所选日期范围显示历史能源数据的能源桑基图卡片,此卡片显示的是当前功率值,不受日期选择器影响。
它会可视化功率从来源(如电网、太阳能板和电池)实时流向家中各个消耗端的过程。如果已配置,设备会按楼层和区域分组。
YAML 配置
可以使用以下 YAML 选项。
type:
required: true
description: "power-sankey"
type: string
collection_key:
required: false
description: "卡片使用的集合键。它会将卡片关联到特定的能源仪表盘集合。默认为 energy_dashboard。"
type: string
default: energy_仪表盘
title:
required: false
description: 卡片标题。
type: string
layout:
required: false
description: "vertical、horizontal 或 auto。决定卡片的方向(流向)。auto 会根据屏幕尺寸自动调整。"
type: string
default: auto
group_by_area:
required: false
description: 是否按区域对设备进行分组。
type: boolean
default: true
group_by_floor:
required: false
description: 是否按楼层对设备进行分组。
type: boolean
default: true
Examples
以下示例将流向设置为从左到右:
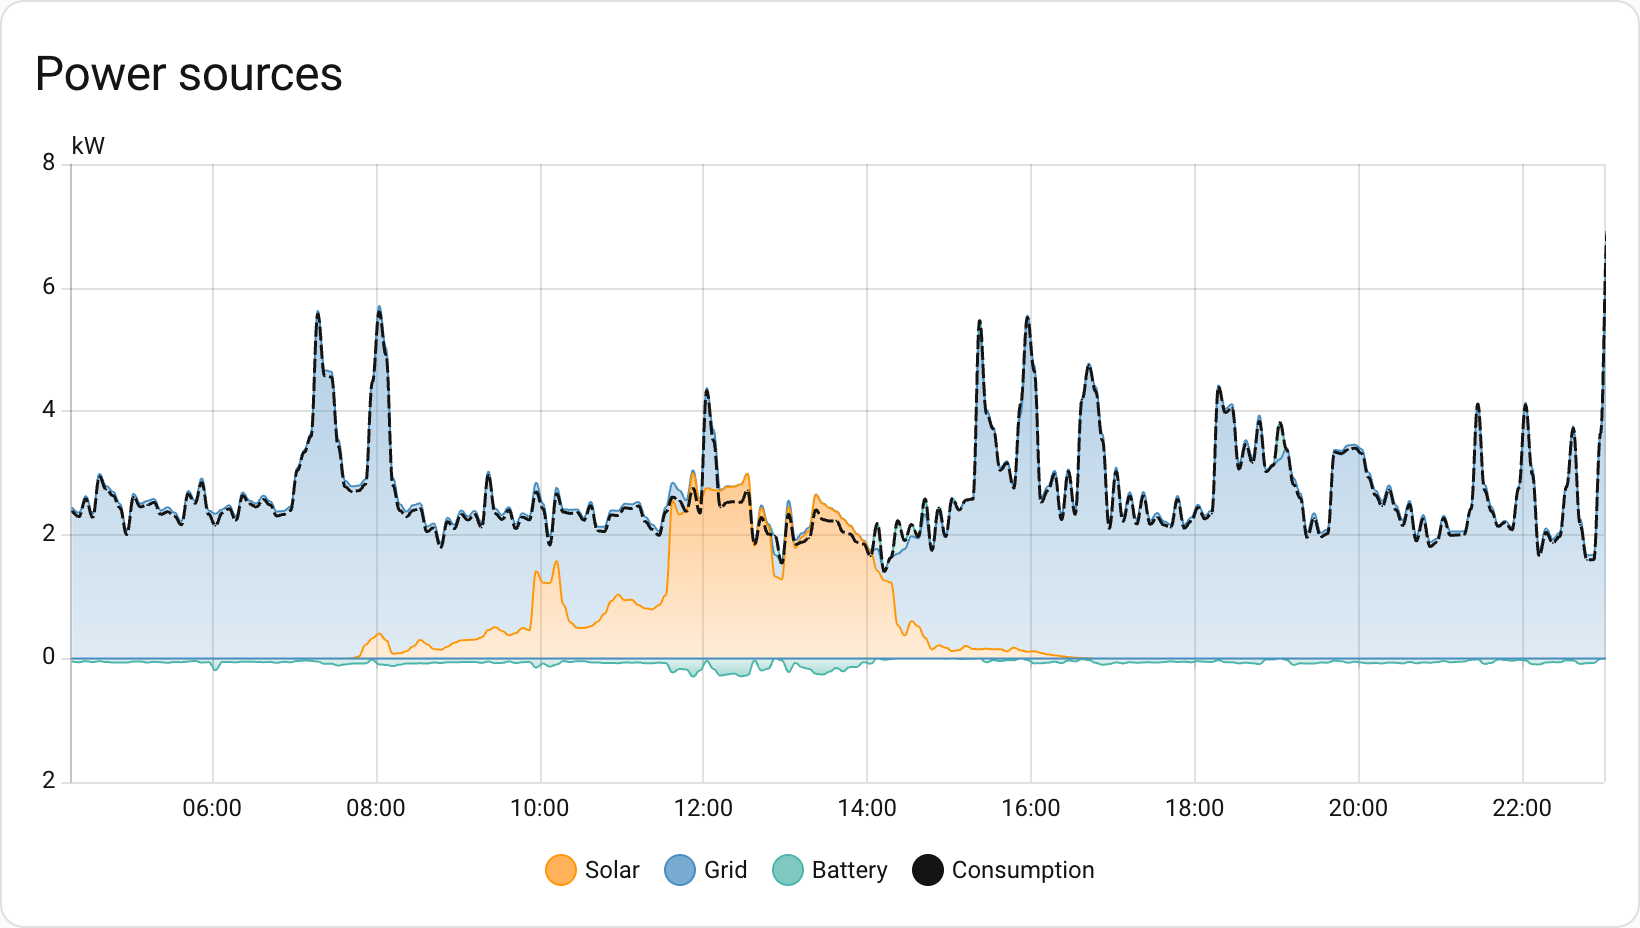
功率来源图表
 功率来源图表卡片截图。
功率来源图表显示历史功率数据。
YAML 配置
可以使用以下 YAML 选项。
type:
required: true
description: "power-sources-graph"
type: string
collection_key:
required: false
description: "卡片使用的集合键。它会将卡片关联到特定的能源仪表盘集合。默认为 energy_dashboard。"
type: string
default: energy_仪表盘
title:
required: false
description: 卡片标题。
type: string
show_legend:
required: false
description: 显示或隐藏图例。
type: boolean
default: true
Examples
功率消耗徽章
![]() 功率消耗徽章截图。
功率消耗徽章截图。
功率消耗徽章显示您家当前的总功率消耗。它会通过结合电网输入、太阳能和电池来源来计算总功率。
YAML 配置
type:
required: true
description: "power-total"
type: string
collection_key:
required: false
description: "徽章使用的集合键。它会将徽章关联到特定的能源仪表盘集合。默认为 energy_dashboard。"
type: string
default: energy_仪表盘
Example
燃气流量徽章
![]() 燃气流量徽章截图。
燃气流量徽章截图。
燃气流量徽章显示所有已配置燃气来源的当前总流量。
YAML 配置
type:
required: true
description: "gas-total"
type: string
collection_key:
required: false
description: "徽章使用的集合键。它会将徽章关联到特定的能源仪表盘集合。默认为 energy_dashboard。"
type: string
default: energy_仪表盘
Example
水流量徽章
![]() 水流量徽章截图。
水流量徽章截图。
水流量徽章显示所有已配置水源的当前总流量。
YAML 配置
type:
required: true
description: "water-total"
type: string
collection_key:
required: false
description: "徽章使用的集合键。它会将徽章关联到特定的能源仪表盘集合。默认为 energy_dashboard。"
type: string
default: energy_仪表盘
Example
使用多个集合
默认情况下,视图中的所有能源卡片都会关联到任意 energy-date-selection 卡片,而所有 energy-date-selection 卡片也会关联到同一个时间段。若要在同一视图中启用多个不同的日期选择,必须将它们关联到不同的集合。这可以通过在卡片 YAML 中添加 collection_key 变量来实现,并将其设置为任意以 energy_ 开头的自定义字符串。(不以 energy_ 开头的字符串会生成错误。)
所有能源卡片都支持使用 collection_key 选项。
Examples
包含多个集合的视图示例: